Home and Learn: Power BI 2023
The Card Visual in Power BI 2023
In the previous lessons, you have learned how to open a CSV file and load the data into Power BI. You then created a table and a chart from the data. In this lesson, we'll take a look at the Card visual. We'll use the Pets Data again, which you can download below, if you haven't already done so.
Power BI Cards
When you want to convey just one piece of information, a card is the ideal visual. They are like headlines for your dashboards. They are easy to create and style. They look like this, with a bit of formatting:

Let's see how to create one.
If you haven't already done so, download the pet data CSV file here:
Load it into Power BI, just like you did previously.
On the Home ribbon at the top of Power BI, locate the Insert panel.
Click on the Card item:
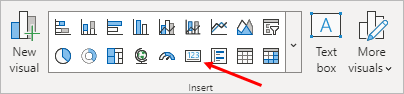
The card item is fourth from the right, on the bottom row, indicated by the red arrow in the image above (it has a 123 icon).
When you click the card item, it will look like this in the dashboard area:

From the data flyout, click the Add data button in the Fields area to see a list of fields you can select for your card:

Select the Owner Age item. The card will turn into this:

Just like in a previous lesson, Power Bi has defaulted to using a Sum for its calculations. We'd rather have the mean age, however. To change it, right-click the field item Sum of Owner. From the menu, select Average, just like you did before. The number on the card should change to 35.33. Let's see how to format the card.
Formatting Power Bi Cards
To format a card, click the paintbrush icon, the one with the plus symbol on it. This will bring up a small popup box. This one:
![]()
Uncheck the box for Category label, if you don't need it. (The label is the text below the number. It says Average of OwnerAge, in the image above.)
Now click the More options button. This will bring up a Format area on the right. You can also access the format area by clicking its icon to the right of the screen:
![]()
Another way to bring up the format area is from the View ribbon at the top of Power BI:

Click to toggle the items on and off.
Let's add a title and subtitle to the card.
Click the Title item in the Format area to expand it. By default, the Title is switched off. Click the little button to turn it on. Expand the Title item to see the sub items:

So, under the Title section there are four subsections: Title, Subtitle, Divider, and Spacing.
Expand the Title section to see this:

It's pretty intuitive - enter some text for your title and select your formatting options. In the image below, we've entered Owner Age as the title. We've changed the text color, the Heading, the font size, and clicked the center alignment icon at the bottom:

Now do the same for the Subtitle. (You need to toggle it on first.) The options are the same as for the title:

You can also add a divider to the bottom of your title and subtitle. Expand the Divider section to see the options:

You can change the color, the style and the width of the divider. For the style, the options in the dropdown box are Dashed, Solid, and Dotted. Set some options here. Play around and see what works for you.
You can set some spacing options for the title, as well. In the image below, we've set the space below title to 10 px (pixels). The Space below subtitle is set to 6 px, and the Space below title area is set to 0 px:

With the Title area done, expand the Callout Value entry to see the options (the callout value is the number on the card):

Again, you can set the font, font size, and the color. But click the dropdown for Display Units and you'll see that you can set choose from the following options:
Auto
None
Thousands
Millions
Billions
Trillions
Underneath the Display units, you can set the number of decimal places you want. Because our callout value is a mean value, we've set ours to 0. This will remove the .33 at the end:

To set background, borders, and shadows for your card, expand the Size and Style item at the top:

The options you can play around with are: Size and position, Padding, Background, Visual border, and Shadow.
Expand the Background, Visual border, and Shadow items to see these options:

Play around with all of these options and see what you can come up with. Here's our finished card:
Aside
Sadly, you can't format a card so it looks something like this:

The card above has a header with a black background color and white text color, which makes the card stand out more.
So, if you can't format a card so that it looks like the one above, how did we do it? The answer is with text boxes. The header is actually a text box. The text box is then positioned above the card. You can then group the two visuals and move them around as one. Let's see how it's done.
The text box visual is on the Home ribbon, just to the right of the Insert panel:

Click the text box visual to add one to your dashboard. It will look like this:

Now click inside the text box and type your text.
It's easy enough to change the font, font size and alignment. You can change the font color by clicking the A and selecting a new color from the dropdown. Standard stuff for formatting text.
However, what you can't do from the formatting panel above the text box is to change the background color of the text box. To change the background color, notice the red arrow in the image above. It's pointing at three little dots in the top right corner of the text box. Click the three dots to reveal a menu:

From the menu, select the Format option. This will bring up the Format panel on the right of Power BI, if it's not already displayed. From the Format panel, expand the Size and style section, then Background. Change the color to anything you like:

Notice that there is also a Size and Position section. Change the width to 200:

(The height can be adjusted, depending on the size of the font you selected for the text box.)
Now deselect your text box and add a card to your dashboard. Add the Units Sold value to the card. Position the card under the text box, making sure to change the width of the card to 200. You'll have something like this:

To group the two together, select either the card or the text box. Hold down the CTRL key on your keyboard. Keep it held down and left-click on the other visual. You'll then have both visuals selected. Now click the Format ribbon at the top of Power BI. Locate the Arrange panel and the Group item:

From the Group menu, select Group: (Notice that there's an ungroup, as well.)

You should now be able to move the text box and card around the dashboard as though they were one visual.
In the next lesson below, you'll see what Power BI slicers are.
<--Back to the Power BI Contents Page