Home and Learn: Power BI 2023
Getting Started with Power BI 2023
In this first lesson, you'll create a quick dashboard, just so you can see what Power BI does and how useful it can be when processing your data. Off we go!
First, download the following CSV file. This will be the data we'll load. (Right-click the file, then select Save/Saves As. Remember where you downloaded the file to.)
Once downloaded, you can take a look at it in a text editor or Excel:
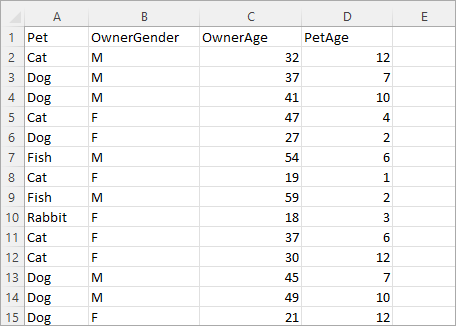
It's just a list of pet types and information on the pet owners. Let's load it into Power BI, though.
Start Power BI. Once it starts, you should see a screen similar to this one appear in the center of Power BI:
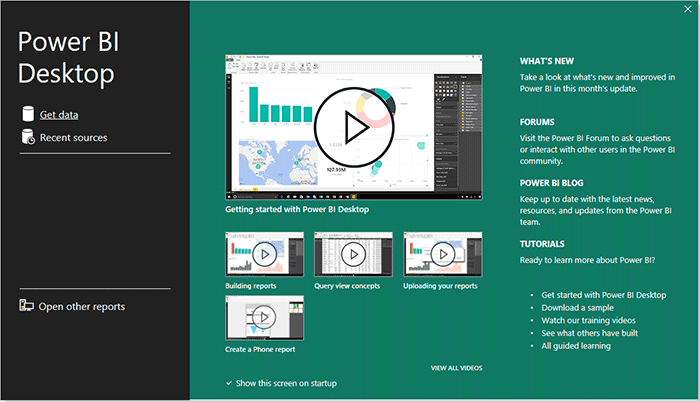
Click on Get Data from the left.
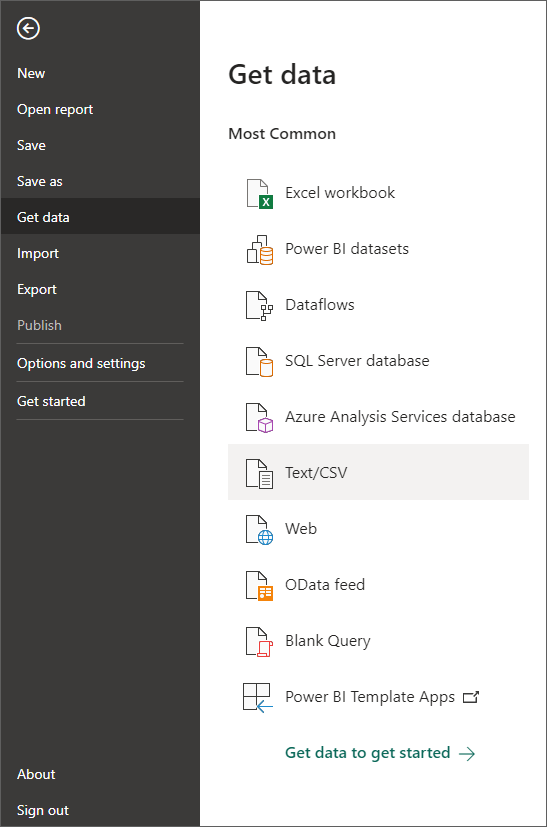
(If you don't see the screen from the image above, click on File at the top of Power BI. From the File menu, select Get data.)
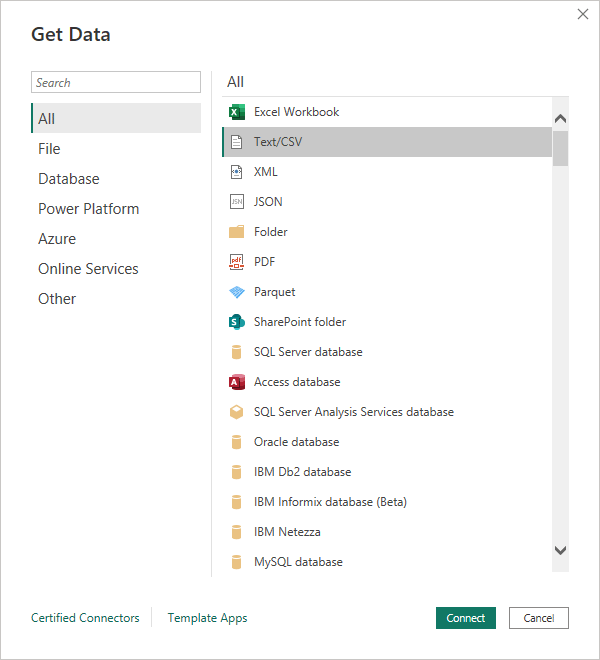
You should see this list appear:
Or this:
As you can see, Power BI can connect to a large range of data providers. It's especially good at connecting to Excel files.
Our file is a CSV file, however. So click on the Text/CSV item. You'll see a standard File Open dialog box appear. Navigate to where on your computer you downloaded the pets data file and open it.
Power BI will connect to your data, and you'll see this screen:
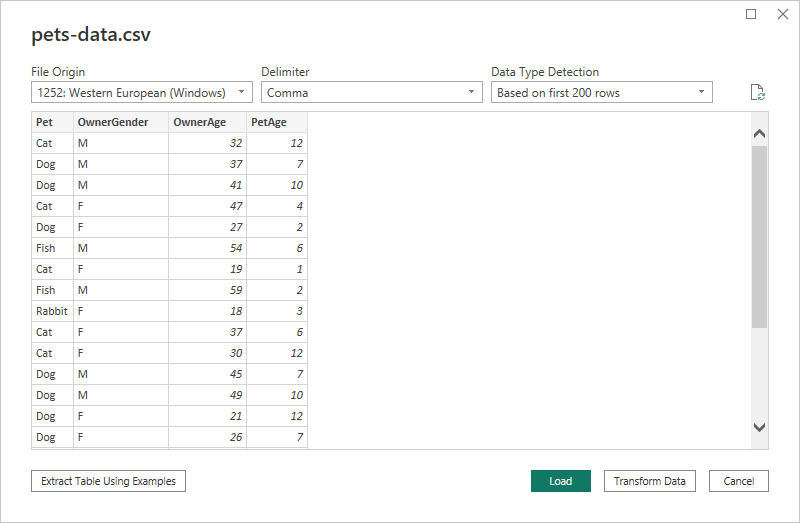
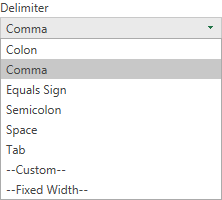
You'll see this screen a lot when you load data in Power BI. At the top, Power BI has guessed correctly that the file has commas to separate the various pieces of information on our file. (The comma is the delimiter.) Click the dropdown to see other delimiters you can choose from:
Power Bi also tries to detect the type of data in each column. Is it a number, a string of text, a date, etc? It is using the first 200 rows to detect the data types. You can change this from the dropdown:
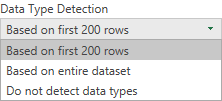
You can change it to, Based on entire dataset or Do not detect data types.
If you look at the grid itself, Power Bi has spotted that the first row of our data is column headers: Pet, OwnerGender, OwnerAge, and PetAge.
Down at the bottom of the screen, there are button to Load the data, Transform the Data, and to Cancel the import. We'll be covering Transform Data in a different lesson. But, if you were to click the Transform Data button, it would open something called Power Query. Again, we'll cover this in a later lesson.
Click the Load button, though. Power BI will get to work loading your data. When it's done, you'll see the main Power BI screen where you'll create your dashboards. This one:
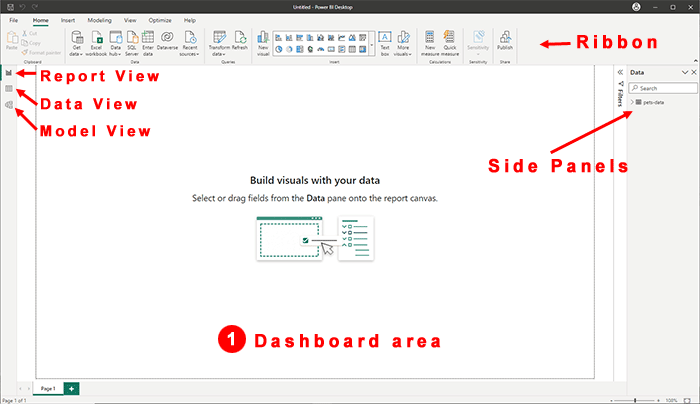
Study this main screen. The largest area is the dashboard itself. You'll be adding all your visuals here. The side panels are where you'll see the data you just imported. At the top, you have the Power BI ribbon, with all its various options.
On the left, you have three different views: report, data and model. The view you're in now is the Report view. Click the other two options. Data view shows you the data in a table, while model view is for building relationships between your tables.
From the Data side panel on the right, expand the pets-data item to see this:
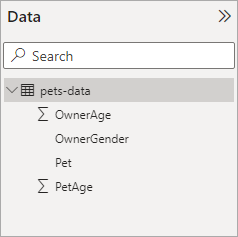
Any data you import into Power Bi will appear here in the Data side panel. The top level item is the table name. (You can right-click the table name and rename it, if you want.)
Notice that each column from our CSV file has a separate entry under the table name.
But let's create a quick visual so you can see how things works. We'll do that in the next lesson below.
<--Back to the Power BI Contents Page