Home and Learn: Power BI 2023
Power BI Dax Measures
In this section, you'll get some experience writing DAX measures. Which begs the question, what is a DAX measure?
DAX is short for Data Analysis Expression. This is a little coding language that lets you write your own formulas. The formulas are called measures.
If that sound too vague, let's get some practical work done. Once you've created a few measures, you'll have a better understanding of what they are. Measures can be very simple (the ones we'll create), or quite complex. But, either way, they let you analyse your data on a much deeper level.
Download the following simple sales data:
Simple Sales Data (Right-click, Save As)
It's very basic data and looks like this in Excel:
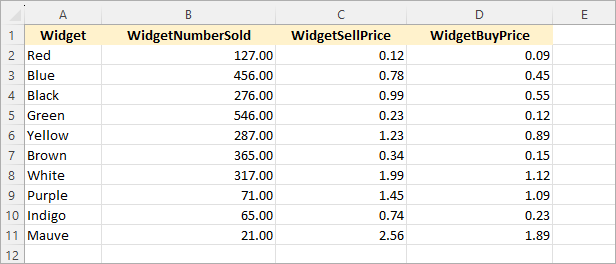
Start a new Power BI project. Load the file you've just downloaded by clicking File > Get Data > Excel Workbook.
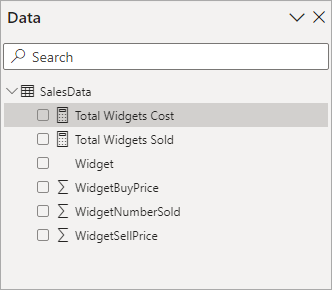
The Data panel on the right of Power BI should look like this:

Right-click on the table name, SalesData. From the menu that appears, select New Measure:
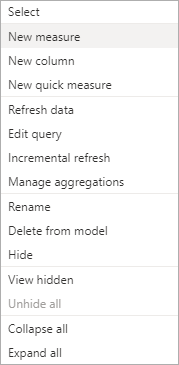
When you click on New Measure, you should see a formula bar appear at the top of your dashboard. This one:
![]()
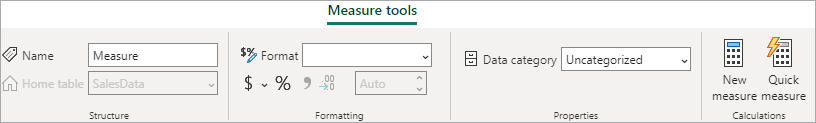
A new ribbon will appear at the top of Power BI, the Measure Tools ribbon:
You'll also see the measure in the Data panel, with a little calculator icon next to it:

By default, your measure will be called Measure. But you can change it to anything you like. You can either type a new name in the Name box on the Measure Tools ribbon. Or you can simply type over the highlighted Measure = in the formula bar. (If you don't want to save the measure, click the X next to the tick symbol in the formula bar. You will be returned to the Power BI dashboard.)
Let's create a simple measure that adds up the number of widgets sold. For this, we need a DAX function called SUM(). In between the round brackets of SUM(), you enter the name of the column from your dataset that you'd like to sum.
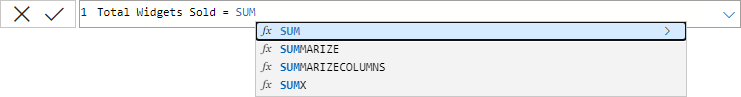
So, enter the following in the DAX formula bar:
Total Widgets Sold = SUM
As soon as you start typing, Power BI will display a list of available functions. Type SU and the list will narrow down:
Use the arrow keys on your keyboard to move up and down the list (or simply left-click with your mouse to select a function) Once you've found the function you want, you can press the TAB key on your keyboard to complete the function.
If Power BI hasn't added the first round bracket, add it yourself. You should then see another list popup. This one:

This is a list of column names you can choose from. Select your column name from the list. Select SalesData[WidgetNumberSold]:
Notice that the syntax is this:
TABLE_NAME[ COL_NAME ]
The name of your table comes first. In between square brackets, you add your column name. Our table is called SalesData. The column name is WidgetNumberSold. This is the column we want to sum.
Now type the end round bracket:
![]()
The whole line, should you want to copy and paste it, is this:
Total Widgets Sold = SUM(SalesData[WidgetNumberSold])
Now, either hit the Enter key on your keyboard, or click this tick symbol to the left of the formula bar. Your formula will be evaluated. If there are no errors, Power BI will place the result of your DAX formula into the name you came up with on the left of the equal sign. For us, the total number of widgets sales is now held under the name Total Widgets Sold.
(If you made an error, or DAX doesn't know what the hell you're talking about, POWER BI will let you know, usually by displaying a very enigmatic error message.)
When you press the Enter key on your keyboard, it will look like nothing has happened. But take a look at the Data panel to the right of Power BI. Your new measure will be there:

Notice that default name of Measure you saw in a previous image has been changed to the name you came up with in the DAX formula bar, the one before the = sign.
You can bring the measure and formula bar back up by simply selecting it in the Data panel.
OK, now that we have a measure, let's do something with it.
Add a card to your dashboard:
When you click the Add Data button from the Build a Visual flyout, you should see your new measure on there:
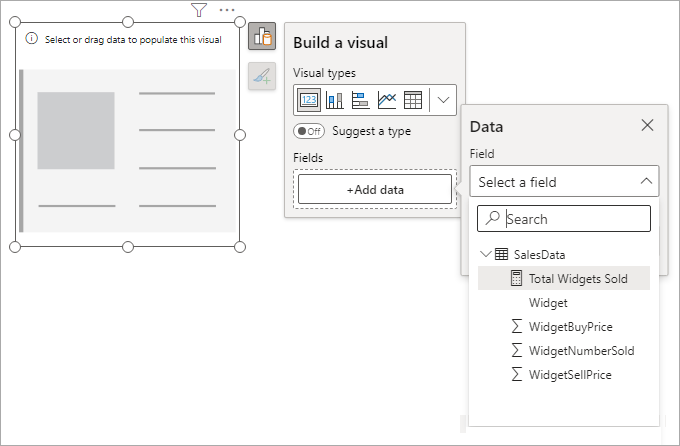
(You can also drag and drop the measure from the Data panel on the right onto your card, rather than go through the flyout.)
And here what your card should look like, once you've selected the measure:

Our measure tells us that we have sold a grand total of 2531 widgets.
Before we create more measures, let's add a table.
Deselect your card and Insert a Table onto your dashboard:
Add the four columns from the dataset:
Widget
WidgetNumberSold
WidgetBuyPrice
WidgetSellPrice
Your table will look something like this: (We've renamed our headers like we did in a previous lesson.)

Notice the figure in the Total row at the bottom of the table for the Widgets Sold - 2531. This is the same figure we got from our measure, and the one that's on our card. Power BI is doing the same thing we did!
So, we can ask some more questions and write measures to answer those questions. We'd like to know the following:
1. How much did it cost us to buy all the widgets
we sold?
2. How much was our sales total?
3. How much were our profits?
To answer the first question, we only need to multiply the number of widgets we sold by the how much it cost us to buy the widgets. This is 2531 * 6.58.
1. How much did it cost us to buy all the widgets we sold?
Create a new measure just like you did for the first one. In the DAX formula bar, instead of the default name Measure = type Total Widgets Cost =.
After the equal sign, type the word Total. You should see the name of the first measure your wrote:

Select the measure and press the tab key on your keyboard to add it to the formula.
Now type an asterisk symbol (*), which is the symbol for multiply. After the asterisk symbol, type SUM. The name of the column you want this time is the WidgetByPrice column:

Type the final round bracket for SUM and your DAX formula should look like this:
![]()
Here it is again, in case you need to copy and paste it:
Total Widgets Cost = [Total Widgets Sold] * SUM(SalesData[WidgetBuyPrice])
What we're doing here is first using the name of our Total Widgets Sold measure. This goes between square brackets. After the multiply symbol, we're using the SUM function again. This time, we need the WidgetBuyPrice column from our SalesData dataset. Power BI will sum up this column and then multiply it by the total we got from our measure. Once the new answer is found, it will store it in the name on the left of the equal sign, which is Total Widgets Cost.
Press Enter on your keyboard to complete the formula, or click the tick.
If you look at the Data panel on the right of Power BI, you'll see that your new measure has been added:
Add a new card to your dashboard. Drag and drop the new measure from the Data panel onto the card. You should see this:

The total cost of buying the widgets is just over 16 thousand. We have some new information here, something that's not in the dataset. And that's at the core of DAX - writing measure to tell you new things about your data.
Let's answer that second question.
2. How much was our sales total?
To answer that question, we only need to multiply how many widgets we sold by how much we sold the widgets for. Create a new measure. Enter this as the DAX formula:
Total Sales = [Total Widgets Sold] * SUM(SalesData[WidgetSellPrice])
Add a new card to your dashboard. Drag and drop your Total Sales
measure onto your new card. If you've got the hang of this, your card
should look like this:
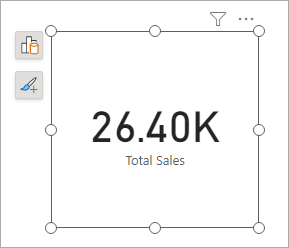
Our Total Sales figure was 26.40K.
Exercise
Write a measure that answers question 3, How much were our profits?
If you get this one right, your card should display a figure of 9.74K
and look like this:

If you're struggling with this exercise, a tip is that you don't need to use SUM. You've already created two measures that can answer the question.
But all your cards might look like this, once you've applied some formatting:

Individual Widget Totals
You can add a slicer to your dashboard and get the card visuals to update when you click on a slicer item.
So, add a slicer to your dashboard:

From the Build a Visual flyout, click the Add Data button and add the Widget item. We covered slicers in a previous lesson, so won't go into them here. In the Format options, under Slicer Settings, you can set the Style to Tile. The slicer will then look like this:

Click on any of your slicer options. What you'll find is that the cards and table update to show just the values from that option. In the image below, we've selected just the Red widget:

This tells us that although we sold 127 Red Widgets, the profits were a measly 3.81. Contrast that to the White Widget:

We sold 317 White Widgets and made a profit of 275.79.
But we wouldn't have any of this information without the use of DAX measures.
Aside: Currency Symbols
As an aside, you might be wondering how we got the currency symbol, in the images above. To add a currency symbol, select your measure in the Data panel on the right of Power BI. From the Measure Tools ribbon at the top, notice that there is a Formatting panel:
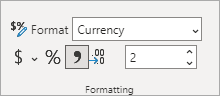
Select Currency from the Format dropdown list. Click the $ sign to see another dropdown where you can select the currency symbol you want.
We'll add more on DAX measures soon. For now, let's move on and look at table formatting.
<--Back to the Power BI Contents Page