Home and Learn: Intermediate Programming
The Chart Project Form

Excel Chart Project: For C# and VB NET Students
Start a new VB Net or C# project for this. Call it anything you like. When your form loads, have a look in the Properties area on the right. You should an entry for References:

Because we're going to be working with Excel, we'll need to add something called a COM reference. COM stands for Component Object Model and is sort of like a code library that allows you to interact with other software. Microsoft have a COM called The Microsoft Excel Object library. At the time of writing, the latest version is 16.
Right-click on References and select Add Reference from the menu:

A dialog box will appear. Click on the COM item on the left. You should see a long list of COM objects to choose from. Scroll down and locate the Microsoft Excel 16.0 Object library. Check the box on the left for whatever is the latest version, 16.0 in the image below:

If you're working with older versions of Excel, you might have to select a number lower than the 16.0 above.
Click OK and expand the References section in the Properties area. You should a new reference for Microsoft.Office.Interop.Excel:

(Don't worry if you don't see all the items in the References list above.
Now that we have a reference to the Office COM library, let's design our form.
Designing the Form
Make your form nice and big, big enough for a chart, anyway. Add a ComboBox control to the form. Change the Name property to cmbStaff. You can increase the size of your ComboBox by changing the font size. Locate the Font property with your ComboBox selected. Change it to 18 points for the size, with Microsoft Sans Serif as the font, and Bold. Change the Text property to Sales Staff.
Add a button to your form. Change the Name property to BtnGetChart and the Text to Get Chart.
Now add a chart. The Chart control can be found under the Data category in the Toolbox on the left of Visual Studio:

Double click to add a chart. Move it near the top. In the properties area, change the Name to chartSales. Change the Size to 600 by 500. Your form should look like this:

The default chart gives you a column chart. We need to change this to a Line chart.
With your chart selected, locate the Series item in the properties area on the right:

Click the little button to the right of (Collection). This will bring up the Series Collection Editor. Locate the ChartType item:
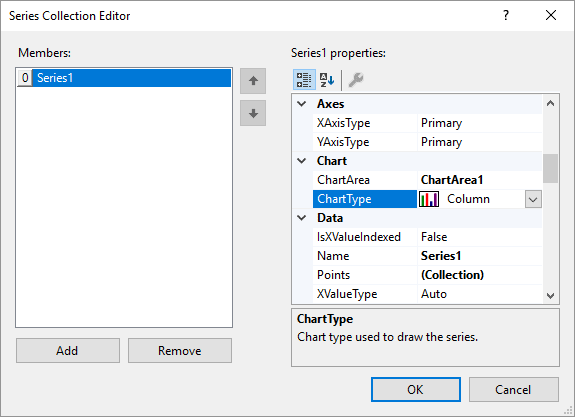
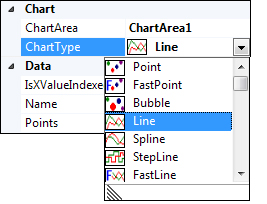
It's set to Column by default. Click the arrow to reveal a dropdown list of charts to choose from. Select Line:
Click OK on the Series Collection Editor and the chart on your form will look like this:

We'll do some more chart formatting a little later. For now, let's crack on with the programming. We'll start with a form load event that grabs Excel and loads the data.

Back to the Intermediate Programming Contents Page