Home and Learn: Intermediate Programming
Backgrounds, Titles, Rounded Corners

Excel Chart Project: For C# and VB NET Students
We'll finish off the chart format in this lesson. Let's start with the chart's background color. We'll add a gradient.
In Design View, click on your chart to select it. In the Properties area on the right of Visual Studio, locate the ChartAreas item. Then click the button to the right of Collection:

This will bring up the ChartAreas Collection Editor. To get a gradient, first select two colors: BackColor and BackSecondaryColor:

Once you have your two colors (you need to do them separately), click on BackGradientStyle:

Select a gradient from the list. We've chosen TopBottom.
(If you prefer, you can select an image instead of gradient. This is done via the BackImage property, two down from the BackGradientStyle item above.)
Click OK on the ChartArea Collection Area box and your chart will look something like this:

To change the background color of the entire chart, the white areas, make sure your chart is selected. In the Properties area, locate the BackColor property:
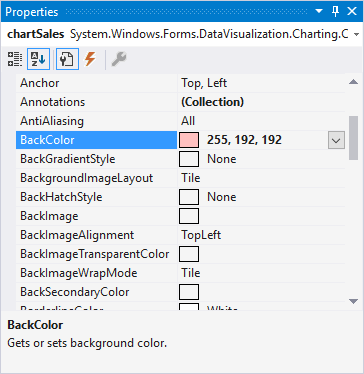
Change it to any colour you like.
If you want to set a solid border around the whole of your chart, change the BorderlineDashStyle property to Solid, the BorderlineWidth to 2 (or any value you like), and set a BorderlineColor:

Chart Titles
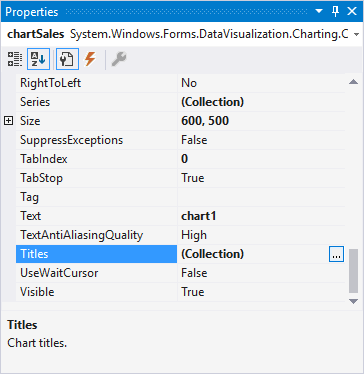
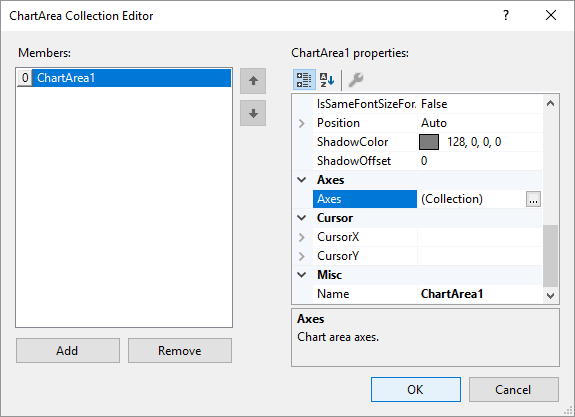
To add a title to the top of your chart, scroll down in the properties area and locate the Titles collection:
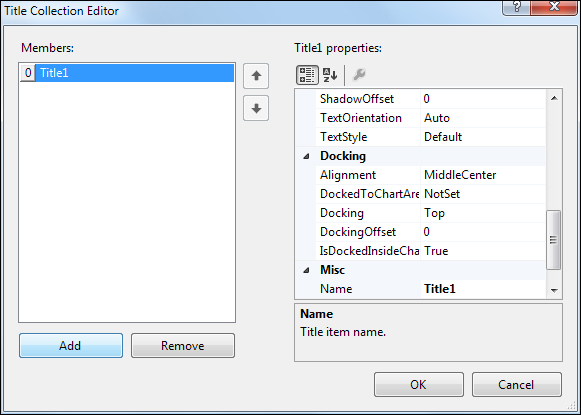
Click the button to bring up the Titles Collection Editor. Click the Add button to add a new title:
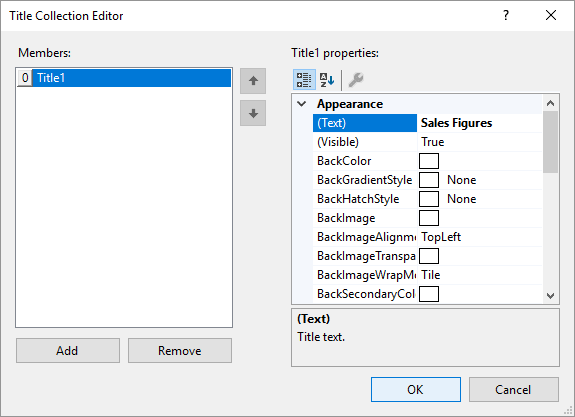
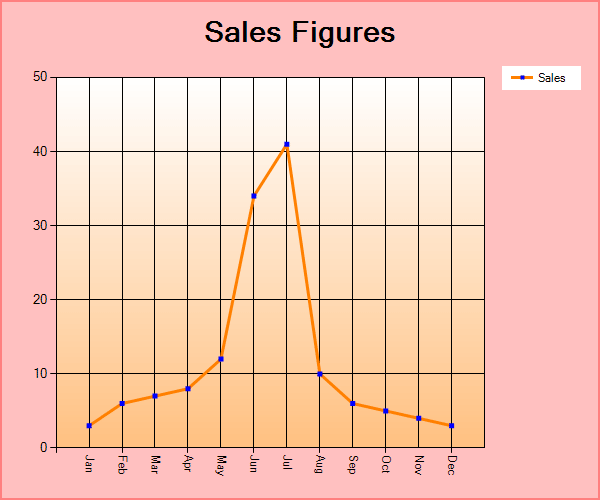
In the Title1 Properties area for your new title, locate the Text property at the top. Type Sales Figures:
Now scroll down and locate the Font property. Change it any font style you like. Click OK on the Titles Collection Editor to return to Design View. Run your program and your chart will look something like this:
If you want to add a title at the bottom, for the X Axis, it's done through the ChartAreas Property again. Bring up the ChartAreas Collection Editor like you did before. Locate the Axes property:
This is another Collection, so you have to click the Collection button. In the Axis Collection Editor, make sure the X Axis is selected under Members on the left. Then locate the Title property. Enter Months as the text:
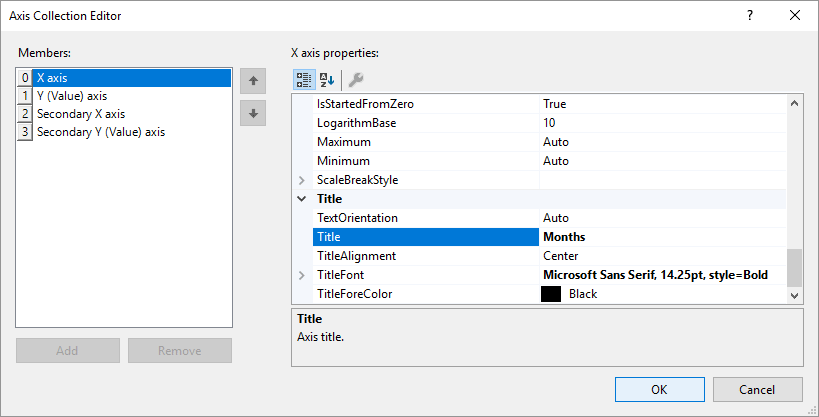
You can set a TitleFont, as well.
Click OK when you're done to get back to the ChartAreas Collection Editor. Click OK on this to set the title at the bottom.
Rounded Corners for your Chart
You can set your chart to have rounded corners.
With your chart selected, locate the BorderSkin property in the Properties area on the right. Expand BorderSkin to see some options. Click the down-arrow for SkinStyle to see the different skins you can apply to a chart:

Select Emboss to get rounded corners.
One thing to notice here is the white background behind the chart, especially where the rounded corners are. To get rid of this, you can set this white background to be transparent. The property you need is PageColor, under the BorderSkin options:
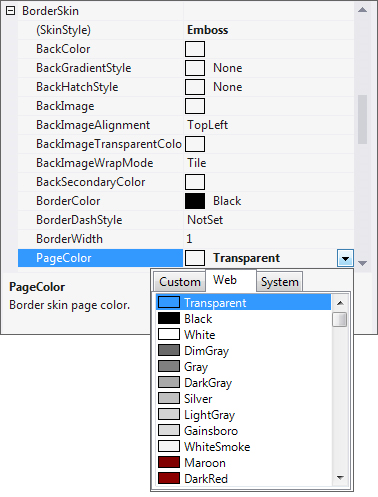
Click the down-arrow of PageColor and select Transparent.
Your chart will look something like this, when you run the program:

Series Formatting
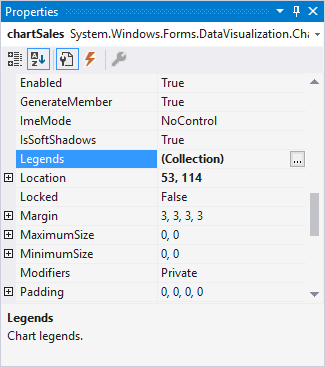
If you don't like the white background for the Series on the right, you can change it. This is done through the Legends property.
With your chart selected, locate the Legends property:
Again, this is a collection. Click the Collection button to bring up the Legends Collection Editor:
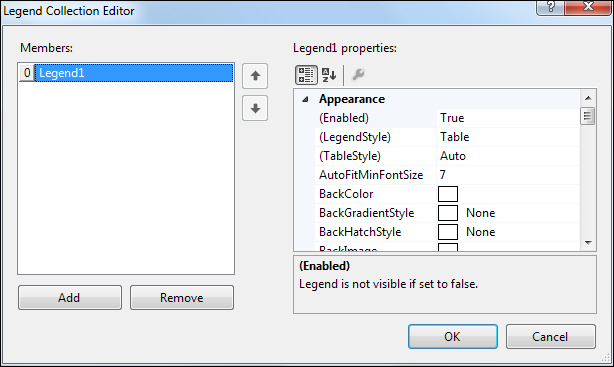
A default Legend of Legend1 has already been added. Each Legend has its own properties. So locate the Font property and change it to bold. Locate the BackColor property and select a new colour to replace the white one. Locate the BorderColor property and change it to anything you like.
Click OK on the Legends Collection Editor when you've made the above changes.
Run your program and here's the finished chart (we've changed the BackColor property of the form itself from the default grey):

And that's it for this Chart project. Hope you enjoyed it!

Back to the Intermediate Programming Contents Page