Home and Learn: Microsoft Excel Course
Excel and Standard Error
Closely related to the Standard Deviation we explored in the previous lesson is something called Standard Error. Let's see what that is.
In the previous lesson, you saw that standard deviation tells you where all the individual exam scores are in relation to the Mean (average). Where they close to the Mean or far away?
Standard error deals with samples of your data and tells you whether or not a sample is close to or far away from your population mean.
To clear that up, let's increase our population of students taking the exam. We'll have 50 students, this time. To save you typing out the names of 50 students and their scores, here's a spreadsheet you can download:
Standard Error Spreadsheet (Right click link and Save)
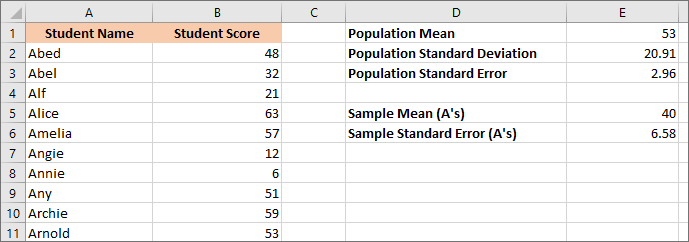
Notice that each group of 10 students all start with the same letter. There are 10 students that start with the letter A, 10 students that start with the letter B, and so on (there's 20 more names on the spreadsheet than in the image below):

First, we'll work out a mean for the population (all students) then take samples and work out standard errors for each sample. You'll then see what standard error does, and what the point of it is. Off we go.
In cell D1 of your spreadsheet, enter the text Population Mean. In cell E1, enter the following formula:
=AVERAGE(B2:B51)
In cell D2, enter the text Population Standard Deviation. To get the standard deviation of the entire population, enter this formula:
=STDEV.P(B2:B51)
Press enter and your spreadsheet will look like this:

Notice we're using STDEV.P again. The P stands for population. All you results, in other words. We'll use STDEV.S when we come to work out the standard deviation samples.
In cell C3, enter the text Population Standard Error.
To work out the standard error, we need this equation:

The SE is short for Standard Error. That strange σ symbol is called a sigma. It's the symbol for standard deviation. Below the dividing line, you need the square root of n. The n is how many values you have, which is 50 for us.
Translating that equation into Excel, gives us this formula for you to enter in cell E3:
=E2 / SQRT(COUNT(B2:B51))
E2 is where our standard deviation is. The COUNT function is how many cells are in the range B2 to B51. This goes between the round brackets of the SQRT function.
(You can use COUNTA, if you want a count the cells that only have values in them. COUNTA will then ignore any blank cells. If you actually wanted to count how many blank cells are in a range, then use COUNTBLANK.)
But we need to do the translating because Excel doesn't have an inbuilt Standard Error formula. (There's an addon you can use, though.) Here's what your spreadsheet should look like:

The standard error of our entire population is 2.96. (We've decreased the decimals to 2 places.)
Now let's grab 10 students from the 50 and get a standard error figure for these 10 students.
In cell D5, enter the text: Sample Mean (A's). In cell D6, enter the text Sample Standard Error (A's).
In cell E5, enter this:
=AVERAGE(B2: B11)
B2 to B11 gets us all the scores for names that begin with the letter A, a sample of our population, in other words.
For the Standard Error, enter this:
=STDEV.S(B2:B11) / SQRT(COUNT(B2:B11))
The new formula is a little more complicated, this time. The first part is this:
STDEV.S(B2:B11)
Previously, we used STDEV.P. Now, we're using STDEV.S. We use the S version because this is a sample of the population. This will get us the standard deviation. To get the standard error, we divide by the square root of how many values we have. Which is this part of the formula:
/ SQRT(COUNT(B2:B11))
Press enter on your keyboard to get a figure of 6.58 when reduced to 2 decimal places. Your spreadsheet should look like this:
Notice that the new standard error is higher than the old one. That's because we're using a sample of the population, just 10 students instead of 50. Remember: the standard error is a measure of how accurate your Mean is. Are you confident that this sample Mean is close to the Population Mean? The standard error is a measure of this confidence: the higher your standard error is, the less confident you are.
Now let's grab some more students. We'll grab the A's and the B's.
In cell D8, enter the text Sample Mean (AB's). In cell D9, enter the text Sample Standard Error (AB's). Get the Mean by using this formula in cell E8:
=AVERAGE=(B2:B21)
In cell E9, enter the formula for the standard error:
=STDEV.S(B2:B21) / SQRT(COUNT(B2:B21))
Press enter and your spreadsheet should look like this:

The standard error is now 4.41 when reduced to 2 decimal places. When we did the A's, we only had 10 students. With the A's and the B's, we now have 20 students. The standard error is getting smaller because we're more confident we're getting closer to the population Mean.
Let's throw in the C's as well, giving us a sample of 30 students.
Enter the text Sample Mean (ABC's) in cell D11. In cell D12, enter Sample Standard Error (ABC's). In cell E11, get the Mean of the values in cell B2 to B31:
=AVERAGE(B2:B31)
In cell E12, get the standard error for these 30 students:
=STDEV.S(B2:B31) / SQRT(COUNT(B2:B31))
Press enter and your spreadsheet should be like this one:
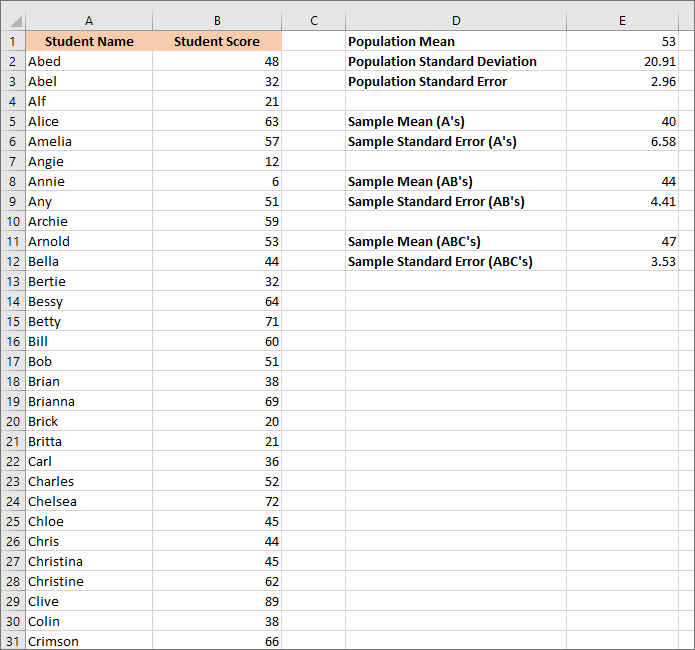
The new figure is 3.53 when reduced to 2 decimal places.
This makes sense: the more values use for your sample size the closer you'll get the true population mean.
You have to bear in mind that quite often, you don't know what the true population mean is. For example, suppose you had an idea to check the mean height of everyone on the planet called Dave. Quite clearly, this is an impossible task. But you don't need to check everyone on the planet called Dave. All you need is a big enough sample size. Your standard error should get lower and lower the more people called Dave you check.
In the next lesson below, you'll learn about something called z-scores. You'll see z-scores a lot in statistics, especially linked to percentiles, which you'll also learn about.
<--Back to the Excel Contents Page