Home and Learn: Microsoft Excel Course
Mean Versus Mean Absolute Deviation Using Excel
In this lesson, you'll use Excel to learn how to calculate something called the Mean Absolute Deviation. This is quite useful in telling you, quite quickly, if a set of values is grouped close together, or if they are far apart. For example, if you are a teacher, you can use Mean Absolute Deviation to tell you if all the scores in an exam are close together or spread far apart. If Deviation is low, that means the students are more or less at the same level. If it's high, then you have students at different ability levels.
To understand MAD, however, we'll need a good understanding of the Mean. So let's get to work.
Excel and Mean Values
The mean is something you're probably familiar with, as it's often called the average of a series of numbers (Excel uses Average for Mean). For example, suppose you join a Facebook group. There's only six of you, which is nice and cosy. Then, someone asks an odd question. How tall is everyone? The results come in (in meters):
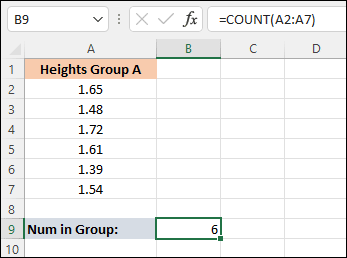
1.65 1.48 1.72 1.61 1.39 1.54
In cell A1 of a new spreadsheet, enter the label Heights Group A. Enter the numbers above in cells A2 to A7. Your spreadsheet should then look like this:

To get the mean height of your group, you add up all the heights and divide by the number of people who responded, 6 in this case. In cell A9, enter the text label Num in Group. In cell B9, enter this:
=COUNT(A2:A7)
When you press enter on your keyboard, your spreadsheet should look like this:
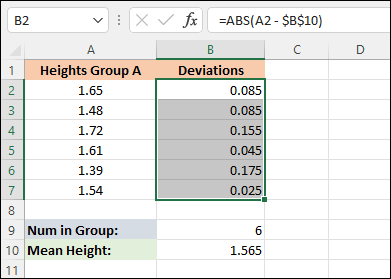
In cell A10, enter the text Mean Height. In cell B10, enter this formula:
= SUM(A2: A7) / B9
Press enter and you'll get an answer of 1.565:

Of course, Excel has a mean function built in, which they call Average (arithmetic mean). So, instead of the long-winded calculation above, you could have just clicked into cell B10 and entered this:
=AVERAGE(A2:A7)
But it's nice to know the intuition behind a formula!
Incidentally, there are two symbols you'll see in statistics for the mean. They are:
μ
x̄
The first one is the greek letter Mu and is used for the population mean. The second one is called an x-bar and is used for the sample mean. Think about an entire school. This would be your population mean. A single class in the school would be a sample mean.
Mean Absolute Deviation
OK, so that's the mean. But what is the Mean Absolute Deviation, and how does it differ? Well, the Mean Absolute Deviation can tell you how spread out your values are, especially when you compare them to another series of numbers. For example, let's take our heights again. Another Facebook group of 6 people have posted their heights. How different from your group are these heights? Do they have smaller and taller people compared to your group? Or are they all about the same size? The Mean Absolute Deviation can tell you at a glance. Let's see how to calculate it in Excel.
We have our heights in cells A2 to A7. And we have a mean value in cell B10. We're going to need that mean because the first step is to find out how far away each value is from the mean.
In cell B1, enter the text heading Deviations. In cell B2, enter this formula:
=ABS(A2 - $B$10)
The ABS is short for Absolute, and this turns negative numbers into positive ones. That's the Absolute part of Mean Absolute Deviation. So, if the mean was 3, you can have any positive number above or below the mean. A value of 3.5, for example, tells you that this person is 0.5 above the mean. A value of 2 tells you that this person is 1 below the mean.
In our formula for Mean Absolute Deviation, we want to subtract the mean value from the height. Our mean value was in cell B10. Press enter and you'll get an answer of 0.085 in cell B2.

To complete the rest of the results, hold your mouse pointer over the bottom right of cell B2. The pointer will turn into a black cross. Hold your left mouse button down. Keep it held down and drag to cell B7. Excel will AutoFill the rest of the results. Your spreadsheet will then look like this:
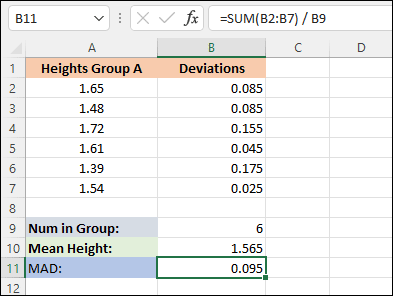
Now, in cell A11, type the label "MAD" (short for Mean Absolute Deviation). In cell B11, enter the following formula:
=SUM(B2: B7) / B9
Excel Function AVEDEV
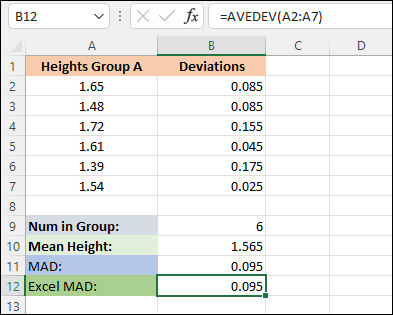
Instead of going through all that, though, Excel has a built in formula to deal with the Mean Absolute Deviation. It's called AVEDEV.
In cell A12, enter the label Excel MAD. In cell B12, enter this:
=AVEDEV(A2:A7)
Press enter and you should get the same result as we got in cell B11.
Let's do another group of heights. In cell C1, enter the label Heights Group B. In cells, C2 to C7, enter the following values:
1.87 1.24 1.59 2.05 1.29 1.45
In cell C12, enter this AVEDEV formula:
=AVEDEV(C2:C7)
You should see a value of 0.255 when you press the enter key on your keyboard.
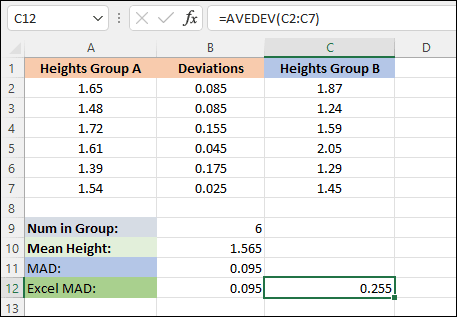
Straightaway, you can see that this value is bigger than the other one. This tells you, at a glance that there is more of a deviation between the heights of group B than there is group A. For Mean Absolute Deviation, the larger the value the more deviation there is in whatever it is you're measuring.
In the next lesson below, you'll learn what the quartile is and how to calculate it in Excel.
<--Back to the Excel Contents Page