Home and Learn: Microsoft Access Course
Microsoft Access - Dates
Following on from the previous lesson, we'll now find out which year in our Access database was the most profitable. (Click the link for previous lesson and you can download the database and follow along.)
Dealing with Years in Microsoft Access
We'd like to know which year was the most profitable and are profits going up or down, year by year?
Create a new query for this. Add the two tables. From the Query Design ribbon at the top of Access, click the Totals item again to add a Total row to the grid at the bottom.
Now, instead of selecting a field from your tables, you can just use a calculated field in the first column of the grid.
We're going to be Grouping By a year. To get the year, you can use the inbuilt Access function Year. Entering the following in the Field box in the first column of the grid:
SalesYear: Year([OrderDate])
In between the round brackets of Year, you can hard-code a date like this:
Year(#25/10/2023#)
Or you can use a field name from your tables. We want to use the OrderDate field to get the year. (We could have used the ship date, as we're only interested in getting the year on the end.) The expression we need is this:
Year([OrderDate])
In between the round brackets of Year, we have the name of our field in square brackets.
Make sure the Total row says Group By.
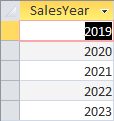
You could run the query right now and you'd get a list of all the years in your table:
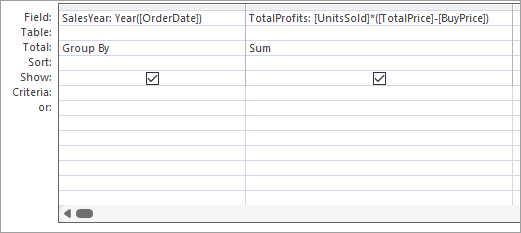
We need to add a profits column, though. This is the same as we did previously. In Query Design View, enter this expression in the blank field to the right of your SalesYear:
TotalProfits: [UnitsSold] * ([TotalPrice] - [BuyPrice])
This is the same expression as before.
Set the Group By dropdown to Sum and your grid will look like this:
Now run your query. You should see this:
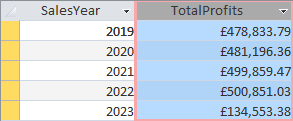
Save your query as qrySalesByYear.
But you can quickly see the sales figures by year, and they are heading upwards. (Except for 2023, which hasn't finished, at the time of writing.)
Now let's get the sales figures by month.
Microsoft Access, Sales by Month, Sorting Months
Just like the Year function, there is a Month function you can use. It's similar to the way the Year function works:
MonthOfYear: Month([OrderDate])
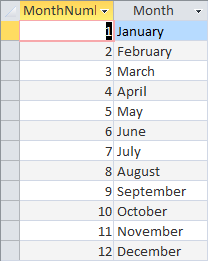
Access returns a number for the year of the month, with 1 being January and 12 being December.
Instead of using the Month function, though, we'll use the Format function.
Access Format Function
The Access Format function can be used for a wide variety of data types, such as numbers, strings and dates. The syntax (the way it's used) is this:
Format( expression , format, first_day_of_week, first_day_of_year)
Only the first item between the round brackets is required, the other three are optional. The way we'll use the function is like this:
Format([OrderDate], 'mmmm')
Yes, that's the letter 'm' four times. You're telling Access to spell out the month fully, so January and not Jan. If you want the short month, then use 'm' three times:
Format([OrderDate], 'mmm')
You can do the same for days of the week:
Format([OrderDate], 'dddd')
Again, the letter 'd' four times gets you the long day (Monday) rather than the short one (Mon).
If you want to grab the year, use Format like this:
Format([OrderDate], 'yyyy')
If you want the short form of the year, (23 rather than 2023) then you need the letter 'y' two times:
Format([OrderDate], 'yy')
If you have a time component to your date, then use Format like this:
Hours
Format([OrderDate], 'h')
Format([OrderDate], 'hh')
One letter 'h' gets you the hours with no leading zeros (12 hour clock). If you use the lowercase letter 'h' two times then you get the leading zero for hours.
If you want to use a 24 hour time, then use capital letters:
Format([OrderDate], 'H')
Format([OrderDate], 'HH')
Seconds
Use the lowercase letter 's' for seconds:
Format([OrderDate], 's')
Format([OrderDate], 'ss')
Use one 's' for no leading zeros and two for leading zeros.
Minutes
Use the lowercase letter 'm' for minutes:
Format([OrderDate], 'm')
Format([OrderDate], 'mm')
Use one 'm' for no leading zeros and two for leading zeros.
But let's get some practical work done.
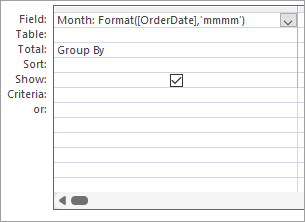
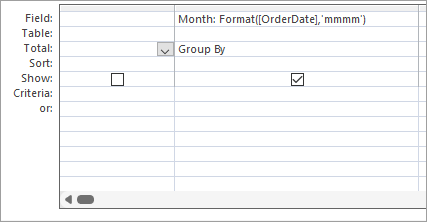
As before, create a new Query. Add the two tables. Enable the Totals row. In the first column of the grid at the bottom of Access, enter the following:
Month: Format([OrderDate], 'mmmm')
Make sure your Total row says Group By:
Run the query and you should see this:
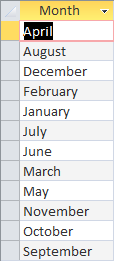
The Access Format function turns the field into a column of text. The text in the column is sorted alphabetically. Of course, you won't want this. You'll probably want January at the top and December at the bottom.
There are a couple of ways to sort text the way you want. But the easiest way is to add another column before the first one and use the Month function. So, even though we said we weren't going to use Month, we're going to use it! But only to help us sort the month names.
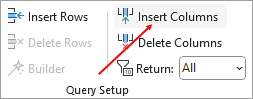
To add a column to the grid, make sure you're in Design View. Click anywhere in the first column where your calculated field is. At the top of Access, click the Query Design ribbon. From Query Design, locate the Query Setup panel and select the Insert Columns item:
A new column will be added to the left of the one clicked inside:
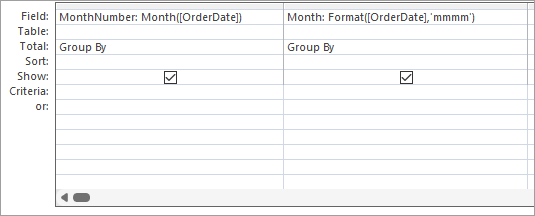
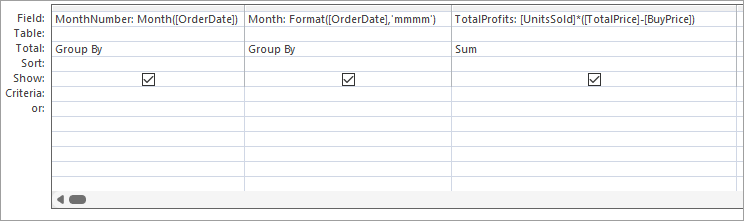
In your new blank column, enter the following in the Field textbox:
MonthNumber: Month([OrderDate])
Make sure the Total row says Group By and your grid will look like this:
Run your query again. This time, the months will be in the correct order:
Now to add the actual calculation - how much a Widget earned each month.
In the third column of your grid, enter the following expression:
TotalProfits: [UnitsSold] * ([TotalPrice] - [BuyPrice])
The same calculation as before. In the Total row, set it to Sum:
Run your query and you should see this:
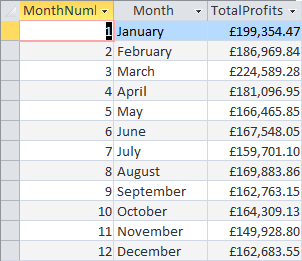
Just what we wanted - a breakdown of sales by month!
Save your query as qryWidgetSalesByMonth.
Now let's see if we can do something with the weekdays.
Which day of the week is the most profitable?
Just like we did for the month, we'll first add a column that will help us sort the days of the week. The function we'll use is called Weekday, and you can specify any day of the week as your start date. Let's see how it works.
Create a new query. Add the two tables. Enable the Totals row. (You should know how to do this by now.)
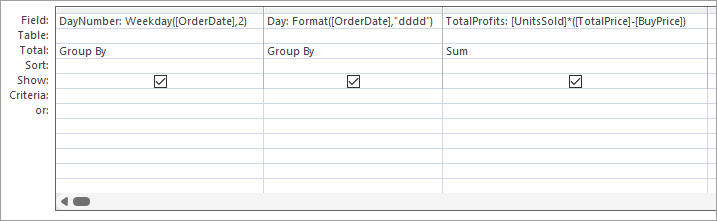
In the first column of your grid at the bottom of Access, enter the following:
DayNumber: Weekday([OrderDate],2)
In between the round brackets of the inbuilt Access function Weekday, we first have the OrderDate field from out WidgetSalesData table. After a comma, we've typed the number 2. This gets you Monday as the first day of the week. If you want to start at another day, type one of these numbers instead:
| Day of Week | First Day Number |
| Sunday | 1 |
| Monday | 2 |
| Tuesday | 3 |
| Wednesday | 4 |
| Thursday | 5 |
| Friday | 6 |
| Saturday | 7 |
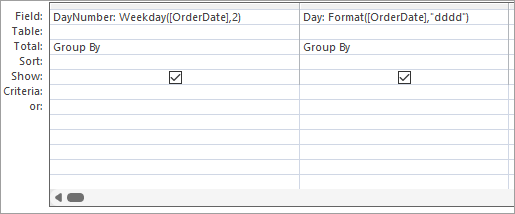
In the second column of the grid, enter this expression:
Day: Format([OrderDate],"dddd")
This gets you the long name for the day of the week. If you want the short name, type the letter 'd' three times instead of four.
Your grid should look like this:
Now add this expression to the third column of the grid:
TotalProfits: [UnitsSold] * ([TotalPrice] - [BuyPrice])
This is the same as before. For the Group By value, change it to Sum:
Run the query to see the results:
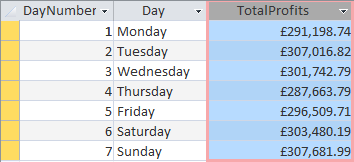
As you can see, we have a nice breakdown of our sales figures for each day of the week. Notice, too, that we start the day on a Monday. And, even though we typed a 2 in our Weekday function, the day number is 1. That's because it's the first day of our week.
Save your query as qryWidgetWalesByDay.
Date Difference
You'll want to know the difference between two dates. In which case, you need the DateDiff function. You use it like this:
DateDiff(interval, first_date, second_date, first_day_of_week, first_week_of_year)
The first three items between the round brackets of DateDiff are required, the other two are optional.
The interval has these options.
| Date Part | Interval |
| Year | yyyy |
| Quarter | q |
| Month | m |
| Day of Year | y |
| Day | d |
| Weekday | w |
| Week | ww |
| Hours | h |
| Minutes | n |
| Seconds | s |
You place the interval between single quote marks:
DateDiff('d', [OrderDate], [ShipDate])
If you want, you can place the two dates between # symbols. Like this:
DateDiff('d', #01/04/2022#, #01/02/2023#)
DateDiff('ww', #01/04/2022#, #01/02/2023#)
The first one would return 306 (the number of days between the two dates), while the second one would return 44 (the number of weeks between the two dates).
Let's try DateDiff out, though.
Create a new query for this. Add the two tables. You don't need the Totals option, this time.
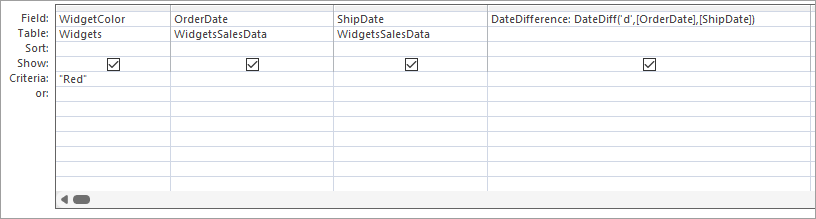
In the first column of the grid at the bottom of Access, select the WidgetColor option from the Field dropdown. Set the Criteria to Red.
In the second column, select the OrderDate item from the Field dropdown.
In the third column, select the ShipDate from the Field dropdown.
In the fourth column, enter this calculated field:
DateDifference: DateDiff('d', [OrderDate], [ShipDate])
Your grid should look like this:
Run your query to see the results:
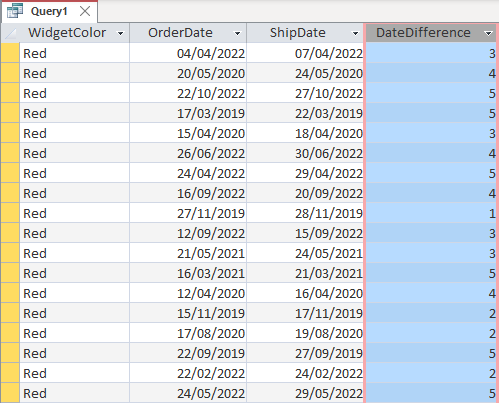
The result in the DateDifference column is how many days it took to ship each Widget.
Save you query as qryOrderShipDays.
We'll stop there with the date functions. There are no more lessons at the moment, but we hope to add further lessons at a future date.
<-- Previous Lesson: More Queries
<--Back to the Microsoft ACCESS Contents Page