Home and Learn: Microsoft Access Course
Microsoft Access More Queries
Following on fom the previous lesson, we're going to answer the following questions:
What are the total sales figures for each color Widget?
What are the total profits for each color Widget?
Which month of the year is the most profitable?
Which day of the week is the most profitable?
Which year was the most profitable?
What are the total sales figures for each color Widget, and what are the total profits for each color Widget?
From the last lesson, we have the profit margin for each Widget. But we'd like to see the total sales figures for each color Widget. We'd also like to display the total profits for each widget. We'll need to use an inbuilt Access function called SUM. We also need to use GroupBy.
Our end goal is to produce two calculated fields, one for the total sales and one for the total profits that each Widget made:

So, just as you did before, create a new Query and add the two tables.
If you look at the grid below, you'll see that there are six rows: Field, Table, Sort, Show, Criteria, or:

However, you can add another row called Total. To do this, locate the Show/Hide panel on the Query Design ribbon at the top of Access:

Click the Totals item. Now look at the grid again. You'll see the new row:

For the Field value in the first column, select the Widgets.WidgetColor again. As soon as you make the selection, Access adds an item called Group By in the Total row:

Notice that Group By is a dropdown box. Click the arrow to reveal the item on the dropdown list:

These are called Aggregate functions, and we'll use the SUM function shortly. But Group By is just like the Unique Values we use earlier. Access will store all the unique values in your field into a group.
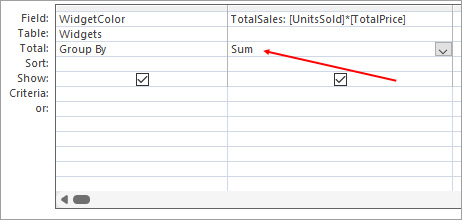
Now click into field box in the second column. Instead of adding a field from one of our tables, we'll add a calculated field. Enter this:
TotalSales: [UnitsSold] * [TotalPrice]
So the field name will be TotalSales. The expression for the field just multiplies the number of units sold by the total price. Your grid should look like this:

Notice that the Total row says Group By. We need to change this. Click the dropdown arrow just like before. This time, select the Sum item:
Now run your query. You should see this:
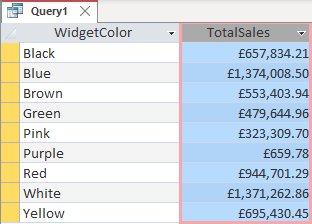
Excellent - we have our TotalSales calculated field showing how much in sales each Widget earned.
Now let's add the total profits. See if you can do this for yourself. Add a new field just to the right of the TotalSales one. Enter this:
TotalProfits: [UnitsSold] * ([TotalPrice] - [BuyPrice])
In the Group By dropdown, change it to Sum again. You should have this:

When you run your query, you should see your new calculated field:

We can quickly see which Widget has the most in sales and which has the most profits.
Save you query. Call it qrySalesProfits. Your All Access Objects are on the left will then look like this:

In the next lesson, we'll do something with the dates.
<-- Previous Lesson: Asking Questions | Next Lesson: Access Dates -->
<--Back to the Microsoft ACCESS Contents Page