Home and Learn: Power BI 2023
Power BI and Dates
Power BI dashboards tend to have date information somewhere. In this lesson, you'll learn how to work with dates.
Download the following spreadsheet.
It only has three columns, one for the item, one for the number of items ordered, and one for the date the item was ordered.
Open Power BI. Click File > Get Data. The file you downloaded was an Excel file, so select the Excel Workbook option to load. You'll soon be looking at this screen:
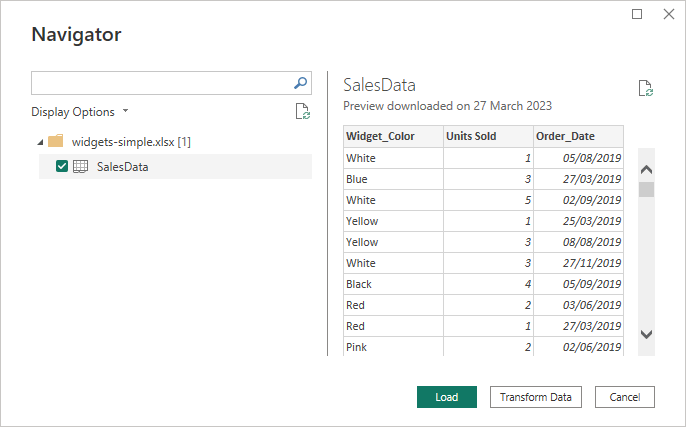
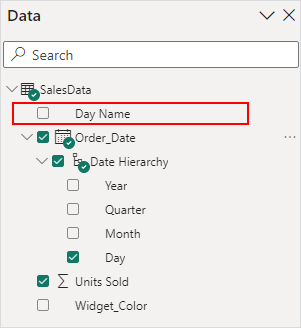
Click the Load button. In Power BI, have a look at the Data panel on the right:
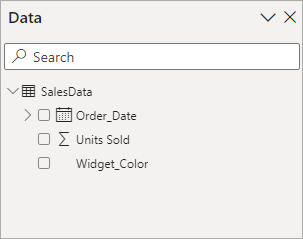
(If you can't see a Data panel, click View from the Power BI ribbons at the top of the screen. From the View menu, toggle the Data item, which is on the Show Panes panel.)
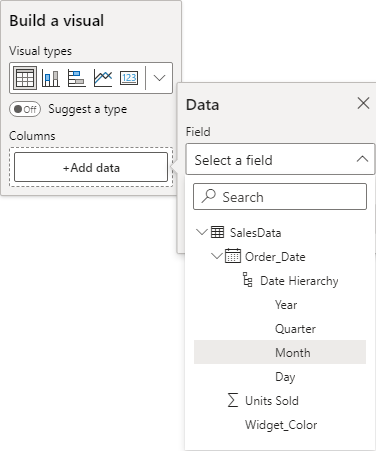
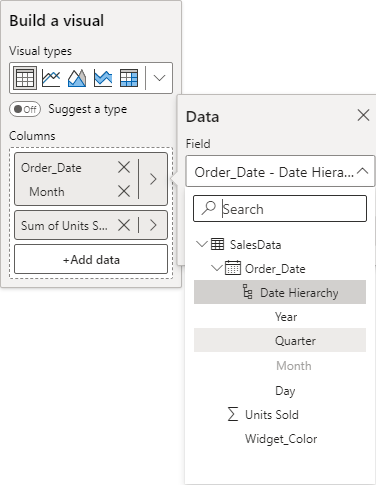
Notice that Order Date item is expandable. Expand the item to see that Power BI has added a Date Hierarchy item. Expand this to see the following:
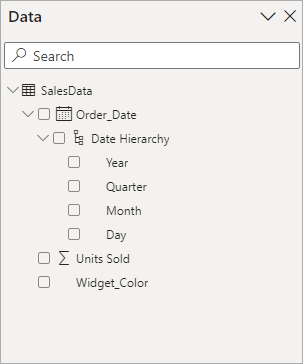
The Order_Date Column is coming from our dataset. Power BI has extracted date parts all by itself. It has extracted a Year, a Quarter, a Month, and a Day. Let's see what these look like.
Add a Table visual to your dashboard:
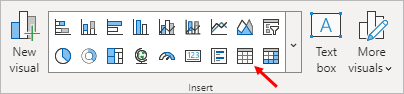
The default table looks like this:
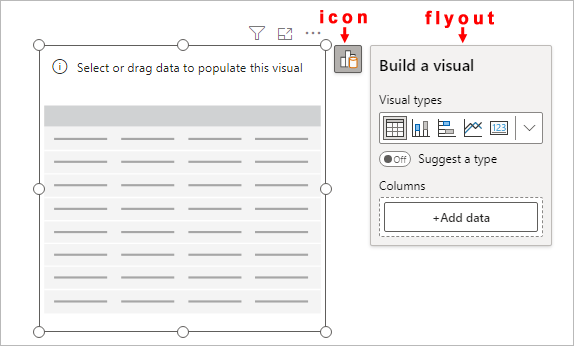
From the flyout, click the Add Data button. Select the Month item from the Date Hierarchy:
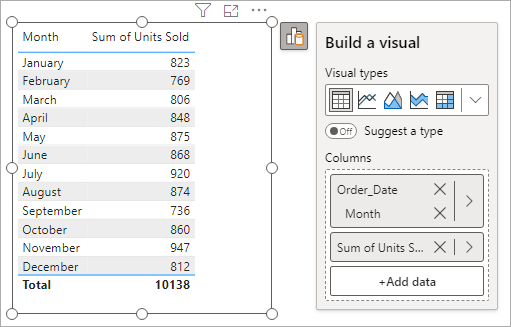
Your table will then have the months in the first column:
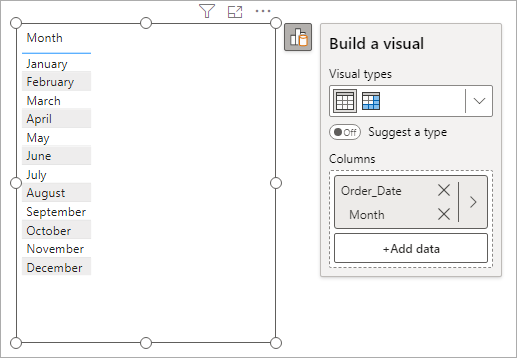
Click the Add Data button again. This time, select the Units Sold item:
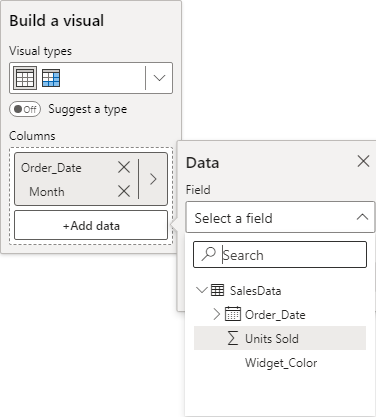
And here's your table:
You can change which date part is displayed in the first column. Let's change the first column from Month to Quarter.
Click the Data Options arrow, indicated in the image below:
![]()
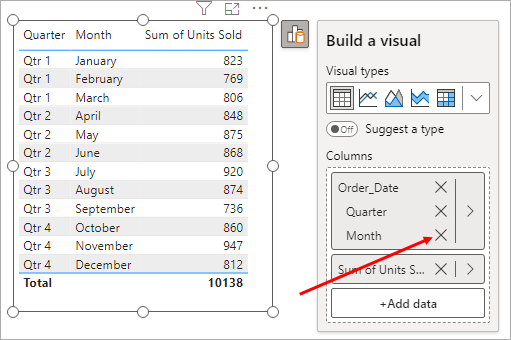
This will bring up another flyout - Data. From this Data flyout, click the dropdown to see a list of your dataset columns again. Select the Quarter item:
Now delete the Month by clicking the X under Columns, as indicated in the image below:
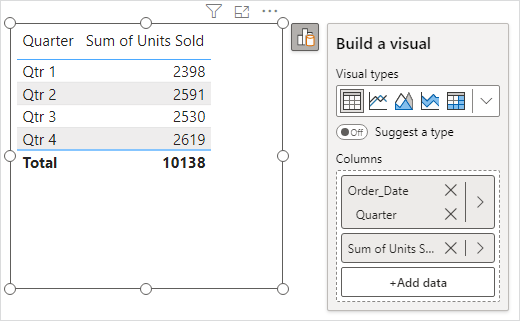
Your table will then show just the quarters:
Using the same technique, turn the Quarters column into Day. Your table will look like this, if you're successful:
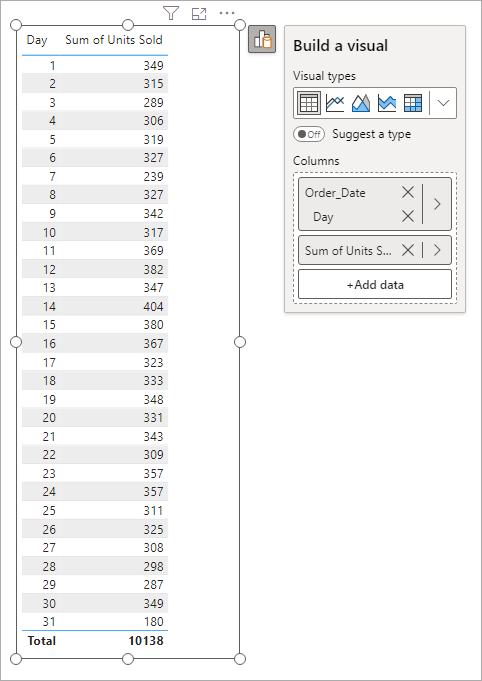
This is not very useful, as it just shows us the day numbers. What would be better if the days were named days, like Monday, Tuesday, etc. Then we could see if any days were better or worse than others. Perhaps one day is particularly bad for sales and we could either close that day, or reduce the number staff working on the bad days.
Days of the Week
In order to get named days, we need Power Query again.
To get Power Query back, right-click the table name in the Data panel on the right of Power BI.
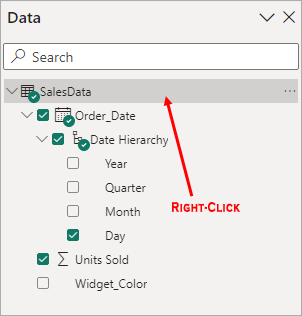
You'll see this menu appear:

From the menu, select Edit Query. This will launch Power Query.
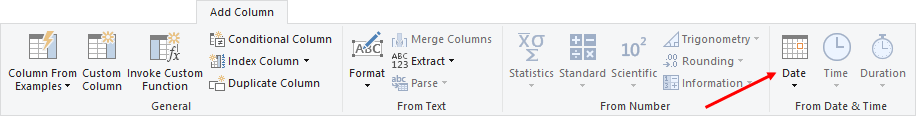
In Power Query, select just the Order_Date column. From the menus at the top, select Add Column. From the Add Column menu, locate the From Date & Time panel and the Date item:
From the Date dropdown menu, select Day > Name of Day:
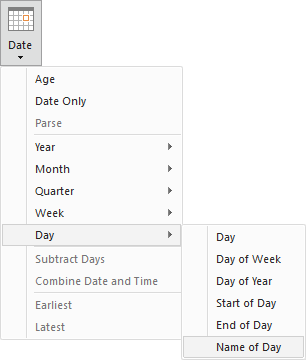
When you select Name of Day, a new column will be added to your table:
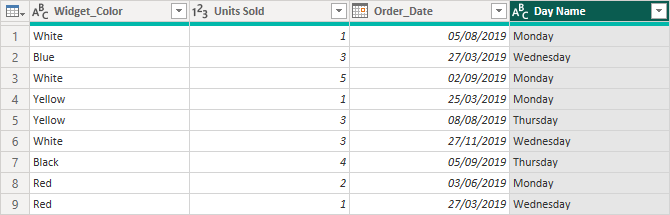
From the menus at the top of Power Query, click Close & Apply. Power Query will close and the new column and its data will appear in the Data area of Power BI:
In your table, change the Day column to Day Name, using the same techniques as above. Your table will then look like this:
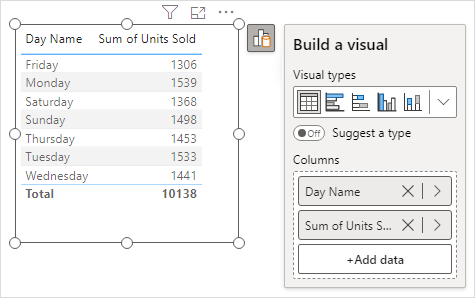
OK, that's better. Now we can see that Friday and Saturday are our slowest sales days. Perhaps we can trim a worker on a Friday!
We'll continue this lesson on new page. Click the link below to go to the next lesson, which is on Date Slicers.
<--Back to the Power BI Contents Page