Home and Learn: Data Analysis
GroupBy in Pandas
The groupby function is used quite a lot in Pandas, and need it for when you want to look at your data from a categorical point of view. For example, take a look at this spreadsheet:

We have three columns: Pet, Sex_Owner, Age_Owner. There are two clear categories here: Pet and Sex_Owner. They are categories because there are a limited number of values. In the Pet column, we have four different animals: Cat, Dog, Fish, Rabbit. For the Sex_Owner, we only have two choices, Male or Female (apologies for the binary nature of this example).
What the groupby function allows you to do is to look at things from the perspective of these groups. Let's see how it works.
If you haven't already done so, download the pets CSV file and save it
to your computer:
Download the Pets Data CSV File (Right-click, Save As)
Start a new Jupyter Notebook and add the following:
import pandas as pd
df_pets = pd.read_csv("PATH_TO_FILE/pets-data.csv")
df_pets.head()
Obviously, change the PATH_TO_FILE to where on your computer you saved the CSV file to.
Run the code and you should see this:

Pretty much what we did before, in previous sections - display the first five rows of our data. Our Dataframe is called df_pets.
If we only wanted to group by the different types of pets, we could do this:
pets_group = df_pets.groupby('Pet')
pets_group
To the right of an equal sign, we have the name of our Dataframe (df_pets). After the Dataframe name, we have the groupby function. In between the round brackets of groupby, we have the name of the column we'd like to split into groups - Pet. (The name of the column goes between quote marks.)
If you run those two lines in your Notebook, you'll see something like this:
<pandas.core.groupby.generic.DataFrameGroupBy object at 0x0000022E0F6BC460>
This message is telling us that pets_group variable is now a DataFrameGroupBy object. Which is what we want. However, what we'd like to do is to split our data into two groups. First, we want to group on the different types of pets, then we want to group on the sex of the owner.
So, run these two lines:
pets_group = df_pets.groupby( ['Pet',
'OwnerGender'] )
pets_group
Again, when you run the lines, you'll see the output telling you that you have a DataFrameGroupBy object. This is useful information, in that you've learned that the pets_group is now a DataFrameGroupBy object. But it's not very useful apart from that. What we need to do next is to execute some sort of function on this new DataFrameGroupBy object. The function we'll use is an agg function. (We did agg functions in a previous lesson, so won't explain it again.)
Try these two lines in a new Jupyter Notebook cell:
agg_mean = pets_group.agg({'OwnerAge':
['mean']})
agg_mean
Run the code and you'll see this output:

The pets_group variable is now a DataFrameGroup object, remember. It has the Pet and OwnerGender information in it. We're just using an agg function to get the mean age of the pet owners. We can quickly see that rabbits are preferred by youngsters while cats and dogs are preferred by older people.
Notice that the Pet column lists our four pets: Cat, Dog, Fish, Rabbit. This was our first group. For each pet, we have a F or an M, which was the second group. On the first row, you can see that if the cat owner is a female then the mean age is 39.6. If the cat owner is a male, the mean age is 49.
You can add other agg functions, just like we did before. Try this:
agg_funcs = pets_group.agg({'Age_Owner': ['mean',
'min', 'max']})
agg_funcs
Run the code to see the following output:

This time, we're using three aggregate functions, mean, min, and max. We have two new columns under the OwnerAge heading, min and max. These get you the minimum value in the column and the maximum value.
You can have the agg function calculate more than one column. So, if we had a column for PetAge, we could do this with the agg function:
aggs2 = pets_group.agg( {
'OwnerAge': ['mean'],
'PetAge': ['mean', 'min', 'max', 'sum']
})
aggs2
The result is this:

Notice how this is laid out and indented in the image above. Because it's Pandas code, rather than Python code, you can indent however you like. It's a lot easier to read, now that the code is split over multiple lines and is indented.
Notice, too, that there is a comma separating the OwnerAge line and the
PetAge line. If you want to work with more than two columns, just remember
to add the comma in the right place.
Now, how can we answer the following question;
Question: What is the mean age of male pet owners and what is the mean age of female pet owners?
To answer this question, first create a new group by OwnerGender:
owner = df_pets.groupby('OwnerGender')
Once you have that group, you can then specify a column from the group. One of the columns is called OwnerAge. You can get the mean of this column like this:
owner.OwnerAge.mean()
The code and the output would be this:
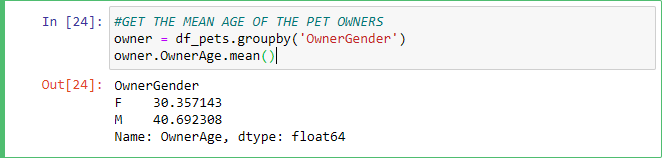
Notice the line that's in green. It's green because it's a comment. You can turn any line of code into a comment by starting the line with the # symbol. But we can quickly see that the mean age for female pet owners is 30 while the mean age for male pet owners is just under 40.
Here's a followup question:
Question: What is the mean age of pet owners by pet type?
You can answer the question in a simliar way. Try this code in a new cell:
owner2 = df_pets.groupby('Pet')
owner2.OwnerAge.mean()
Run the code to see the following:

Another way to get the same data as above is like this:
owner_age_plot = df_pets.groupby('Pet')['OwnerAge'].mean()
This time, we've deliberately called the variable owner_age_plot. That's because Pandas has basic plotting built in. All you need to do is add the function plot():
owner_age_plot.plot()
Run the code to see this:

We'll explore plots and graphs in more detail in a later lesson. For now, let's move on. In the bext lesson, we'll look at the apply function in Pandas.
<< loc, iloc | Pandas Apply >>